Student Satisfaction
Percentage of seniors who evaluate their entire educational experience at George Fox as good or excellent:
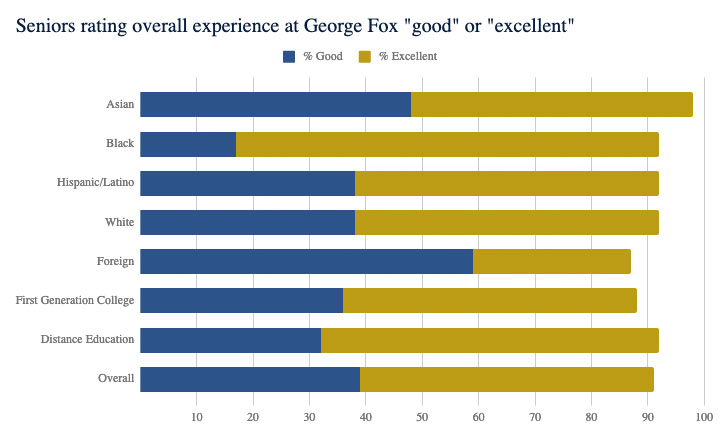
Source: National Survey of Student Engagement, 2013-2019
| Asian | Black | Hispanic/ Latino | White | Foreign | Total | |||||||||||||
| N | % | N | % | N | % | N | % | N | % | N | % | |||||||
| Poor | 0 | 0 | 1 | 8 | 0 | 0 | 10 | 1 | 0 | 0 | 11 | 1 | ||||||
| Fair | 1 | 3 | 0 | 0 | 6 | 8 | 50 | 7 | 9 | 13 | 66 | 7 | ||||||
| Good | 19 | 48 | 2 | 17 | 29 | 38 | 258 | 38 | 40 | 59 | 348 | 39 | ||||||
| Excellent | 20 | 50 | 9 | 75 | 41 | 54 | 368 | 54 | 19 | 28 | 457 | 52 | ||||||
| Total | 40 | 100 | 12 | 100 | 76 | 100 | 686 | 100 | 68 | 100 | 882 | 100 | ||||||
Source: National Survey of Student Engagement 2013-2019