Completion / Graduation Rates
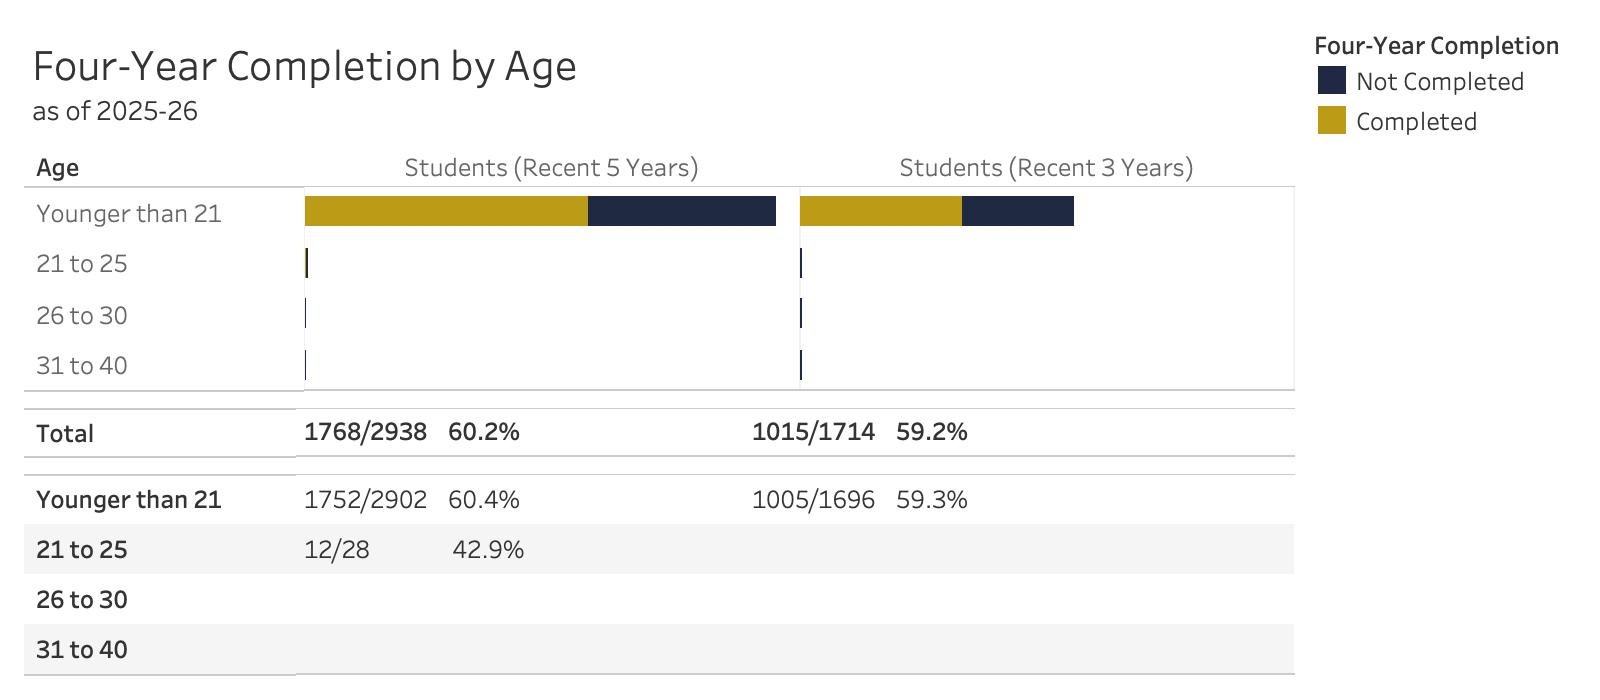
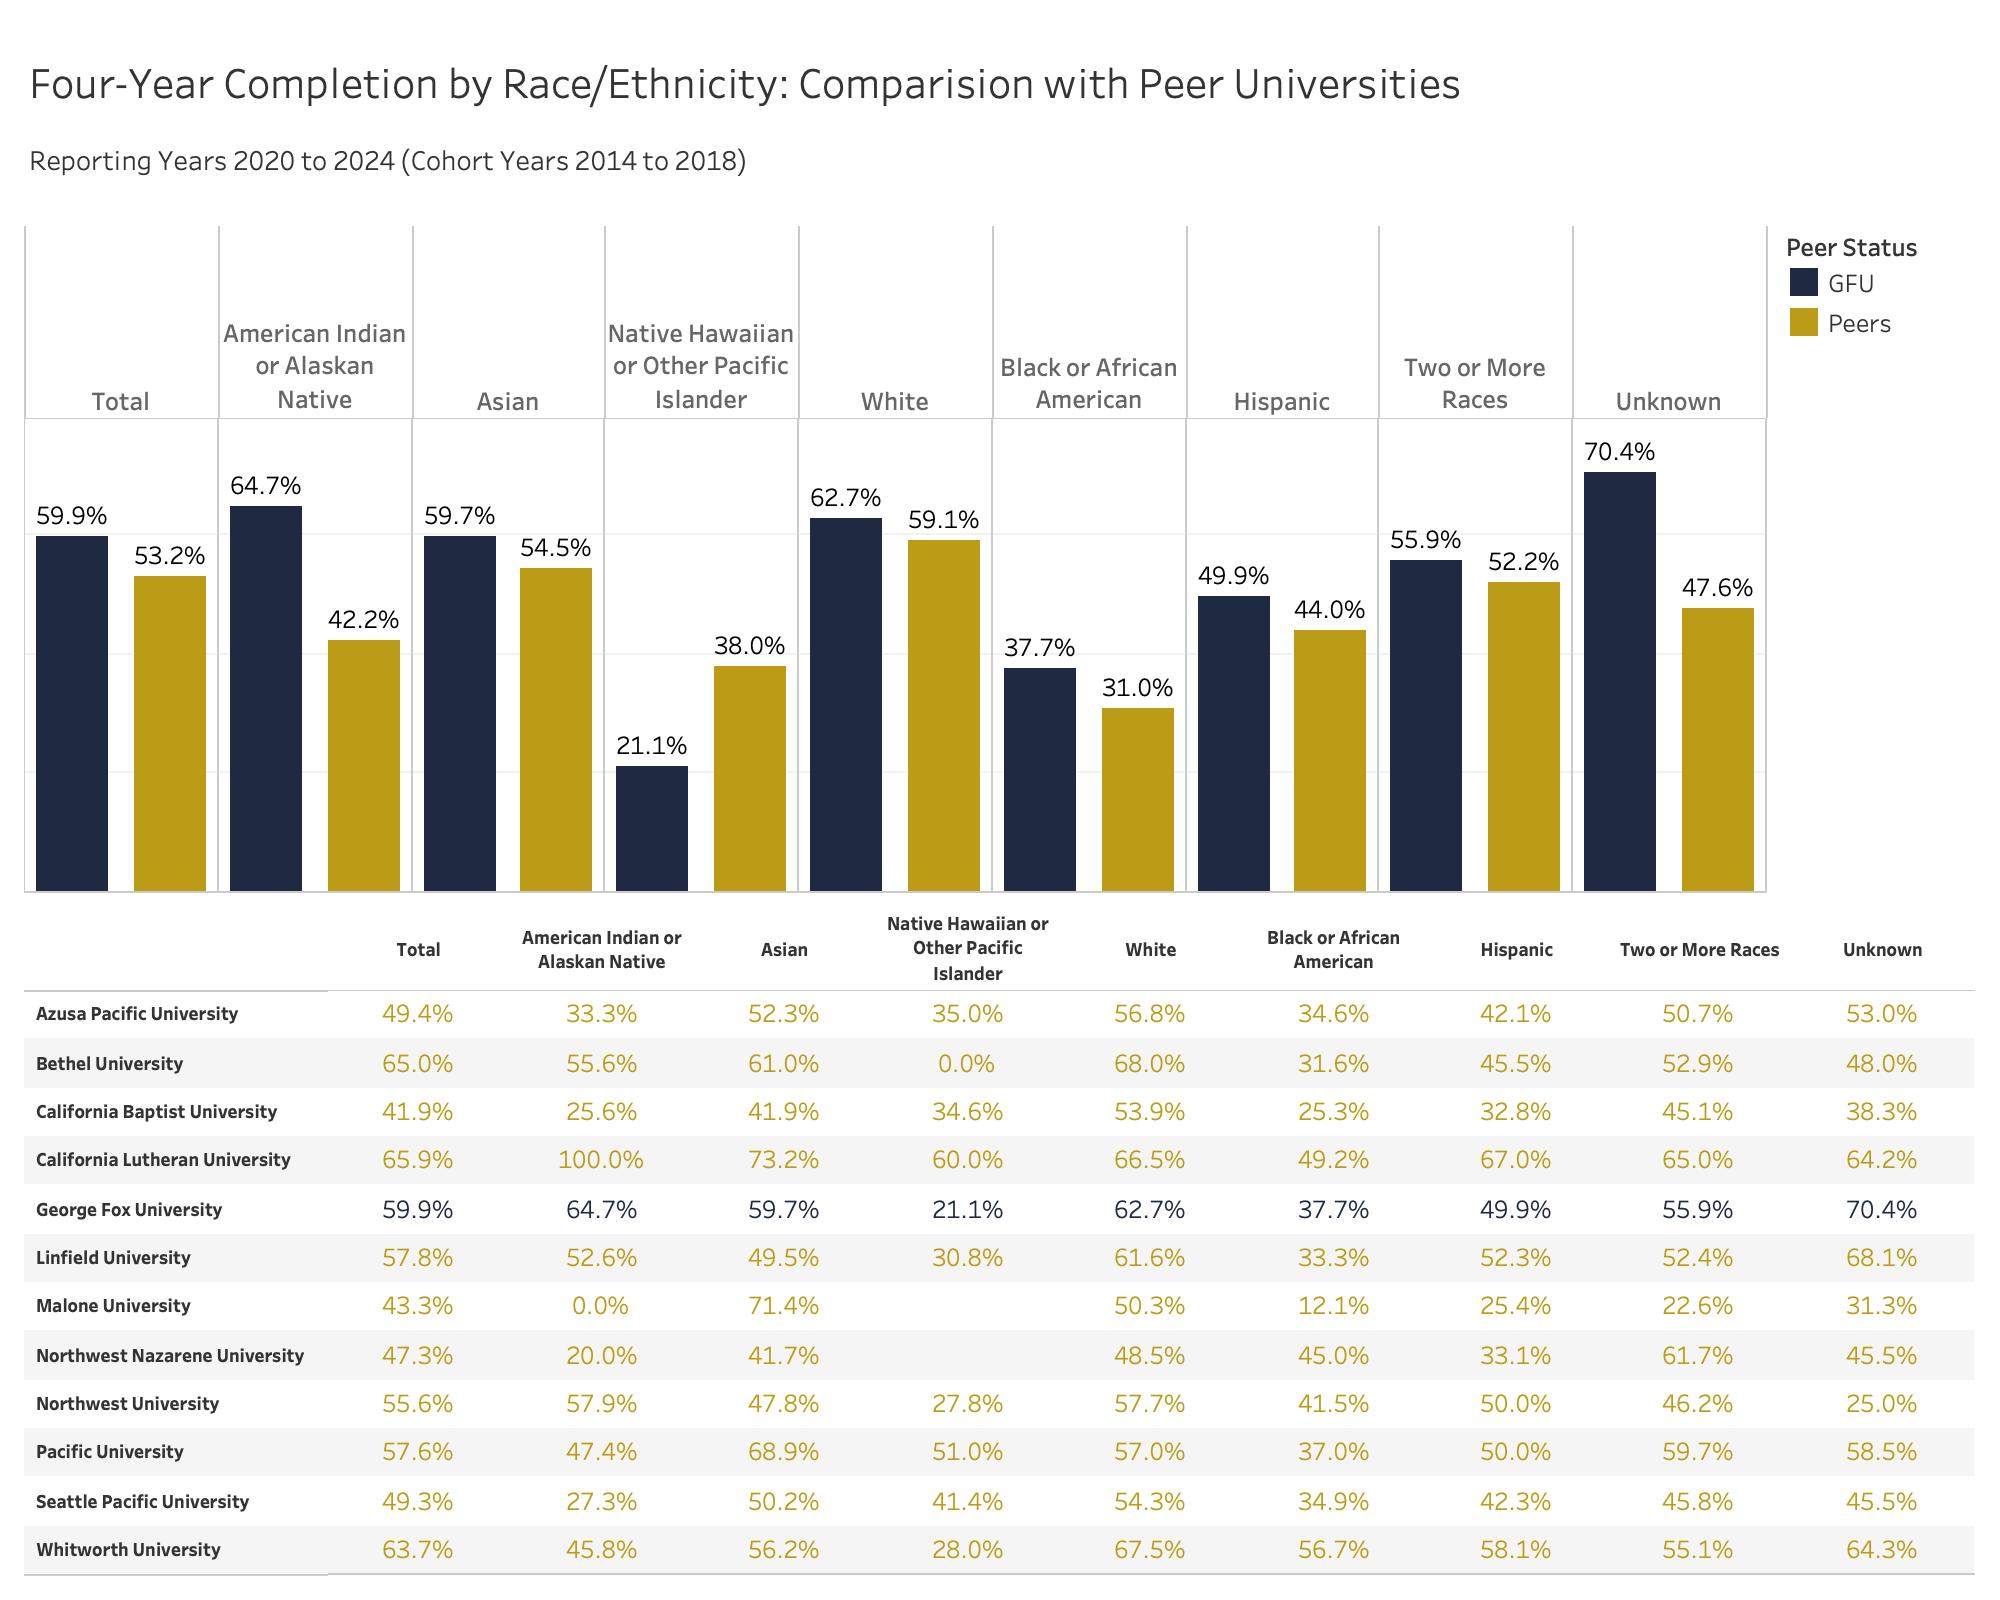
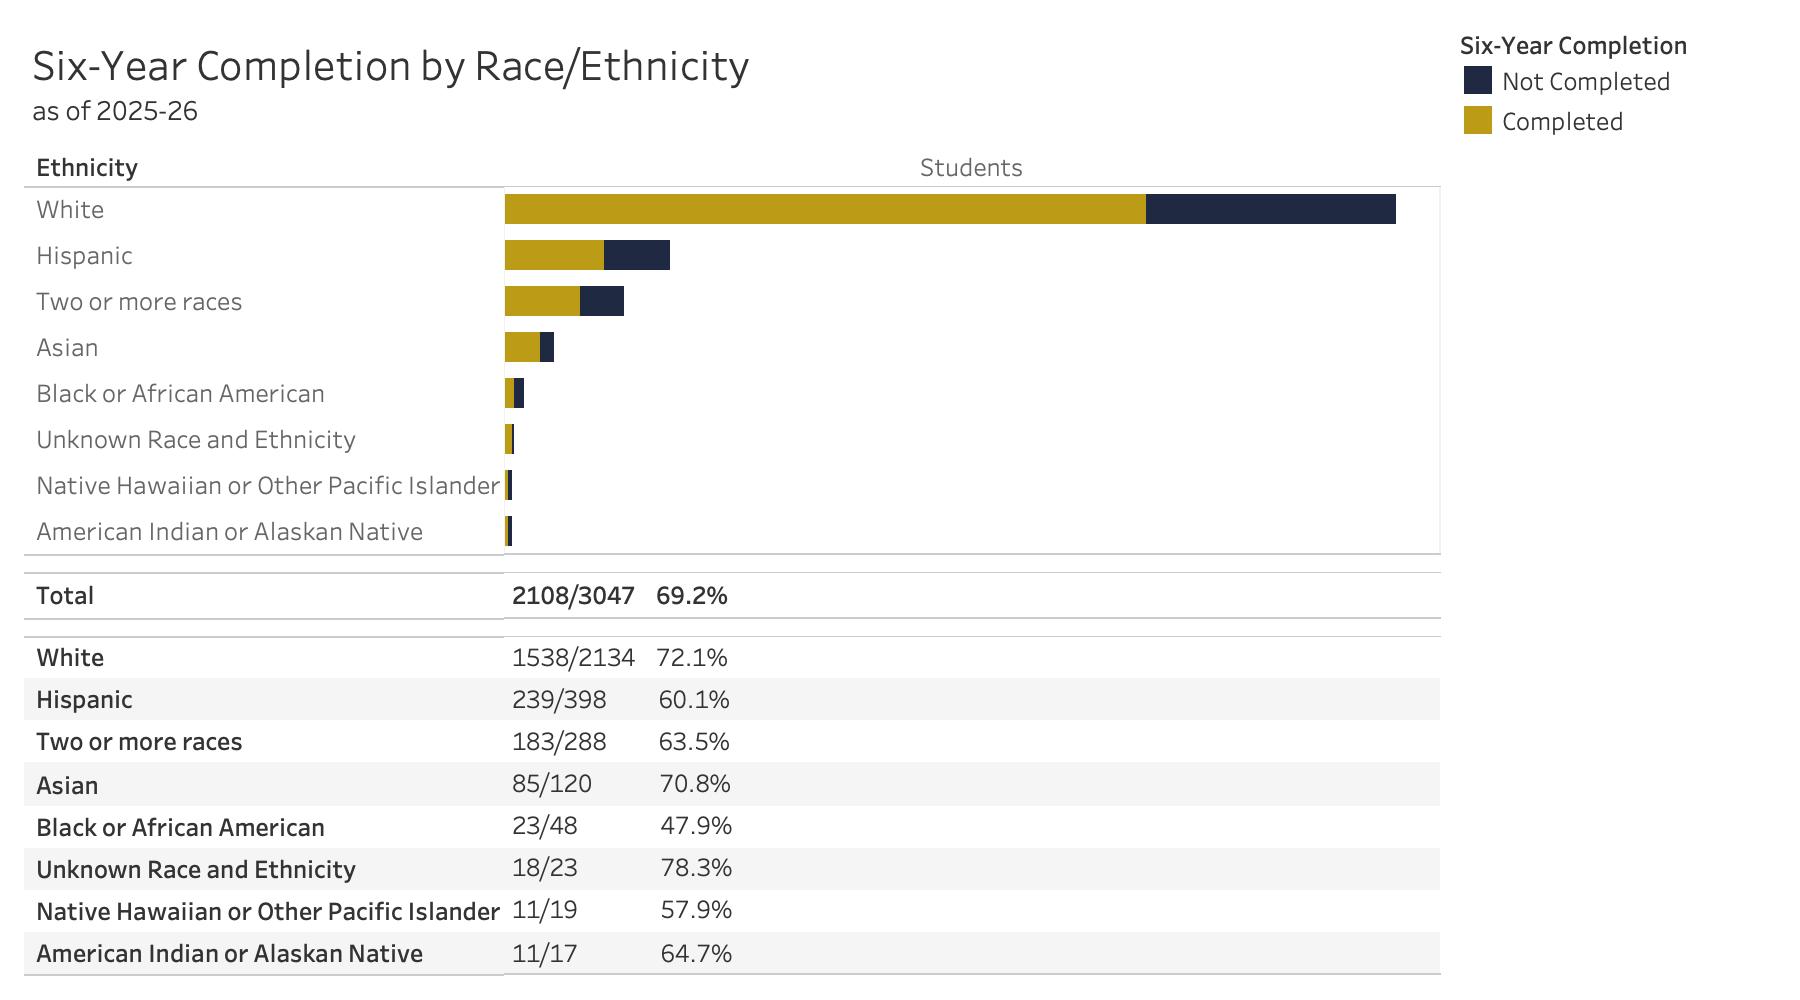
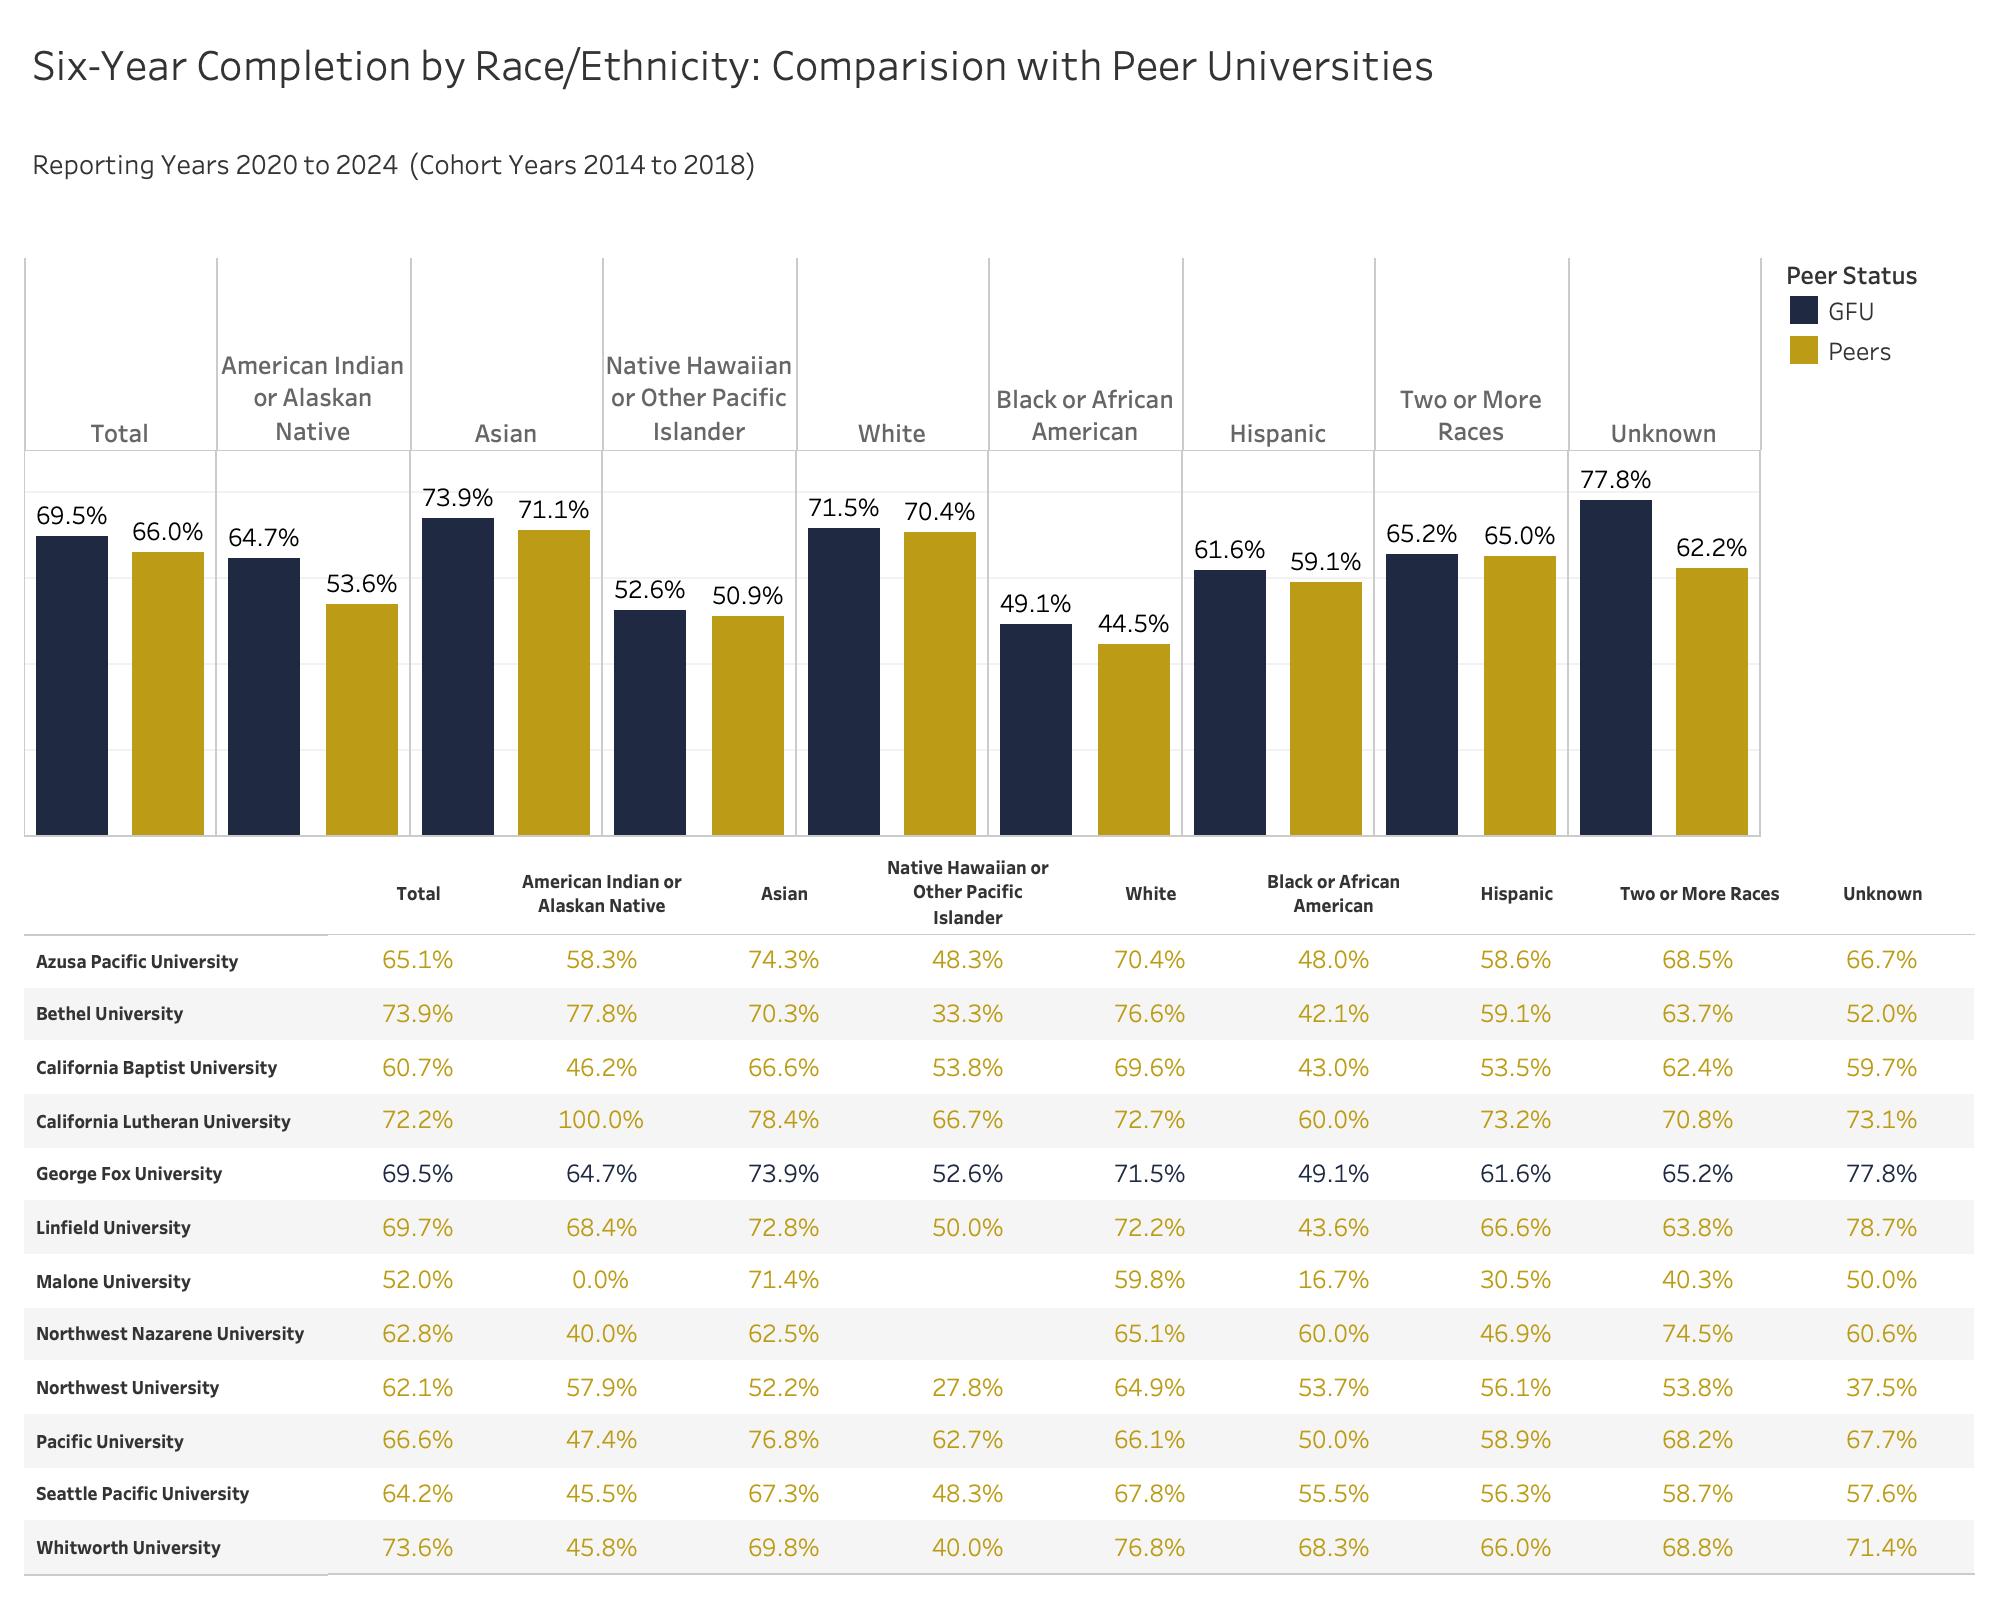
Also known as graduation rates, completion rates express the percentage of first-year full-time students who gain a bachelor's degree within a four-year or six-year period.
Race & Ethnicity
Source: IPEDS
Source: IPEDS
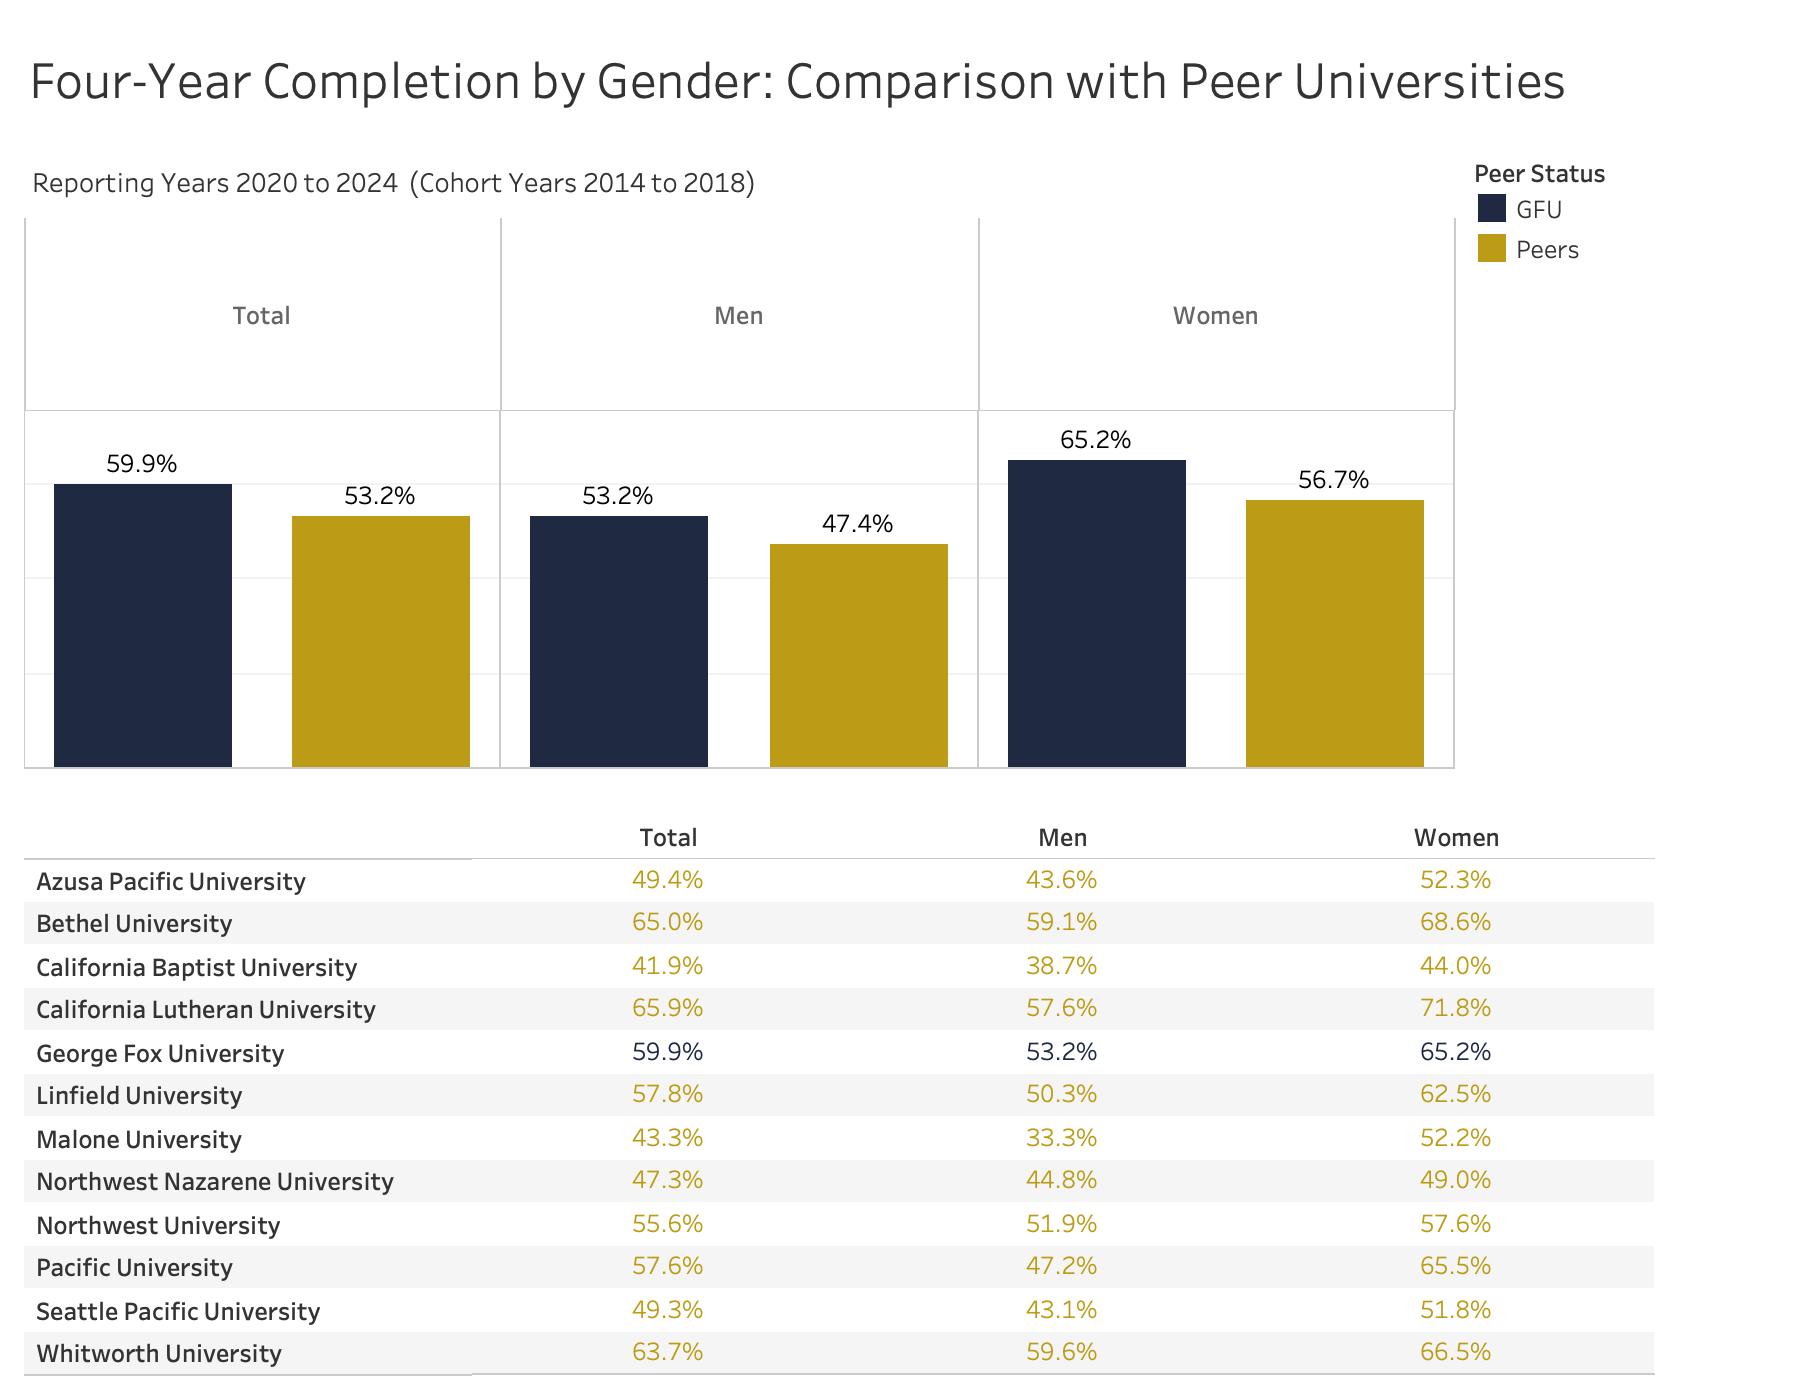
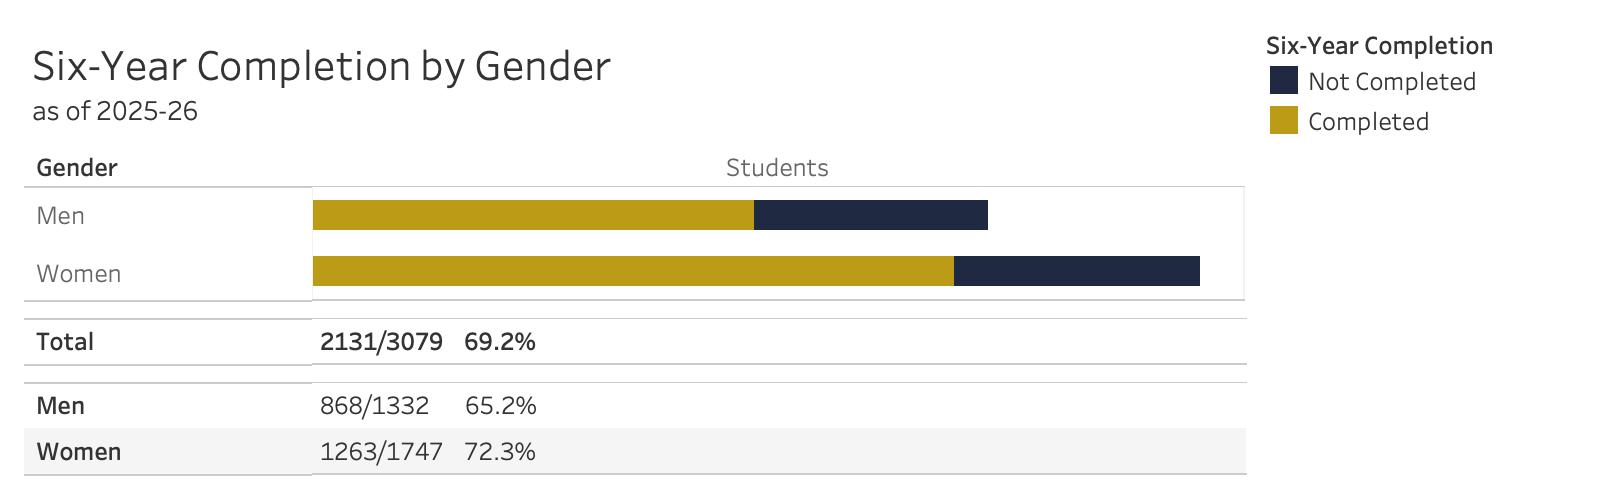
Gender
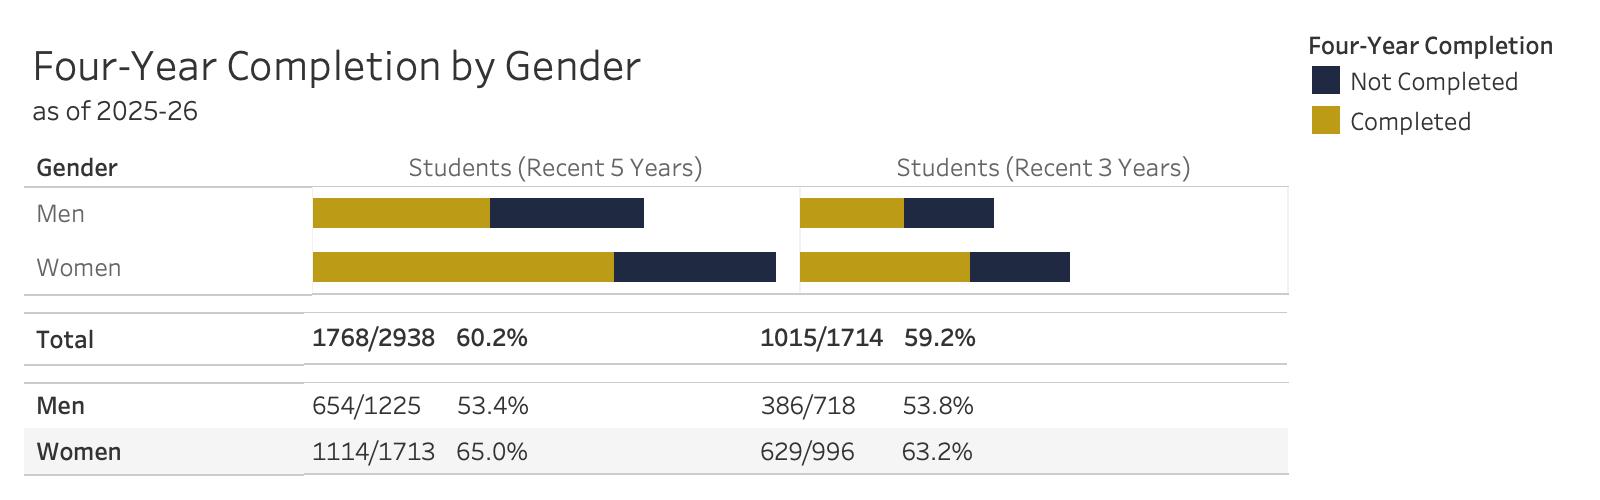
Source: IPEDS
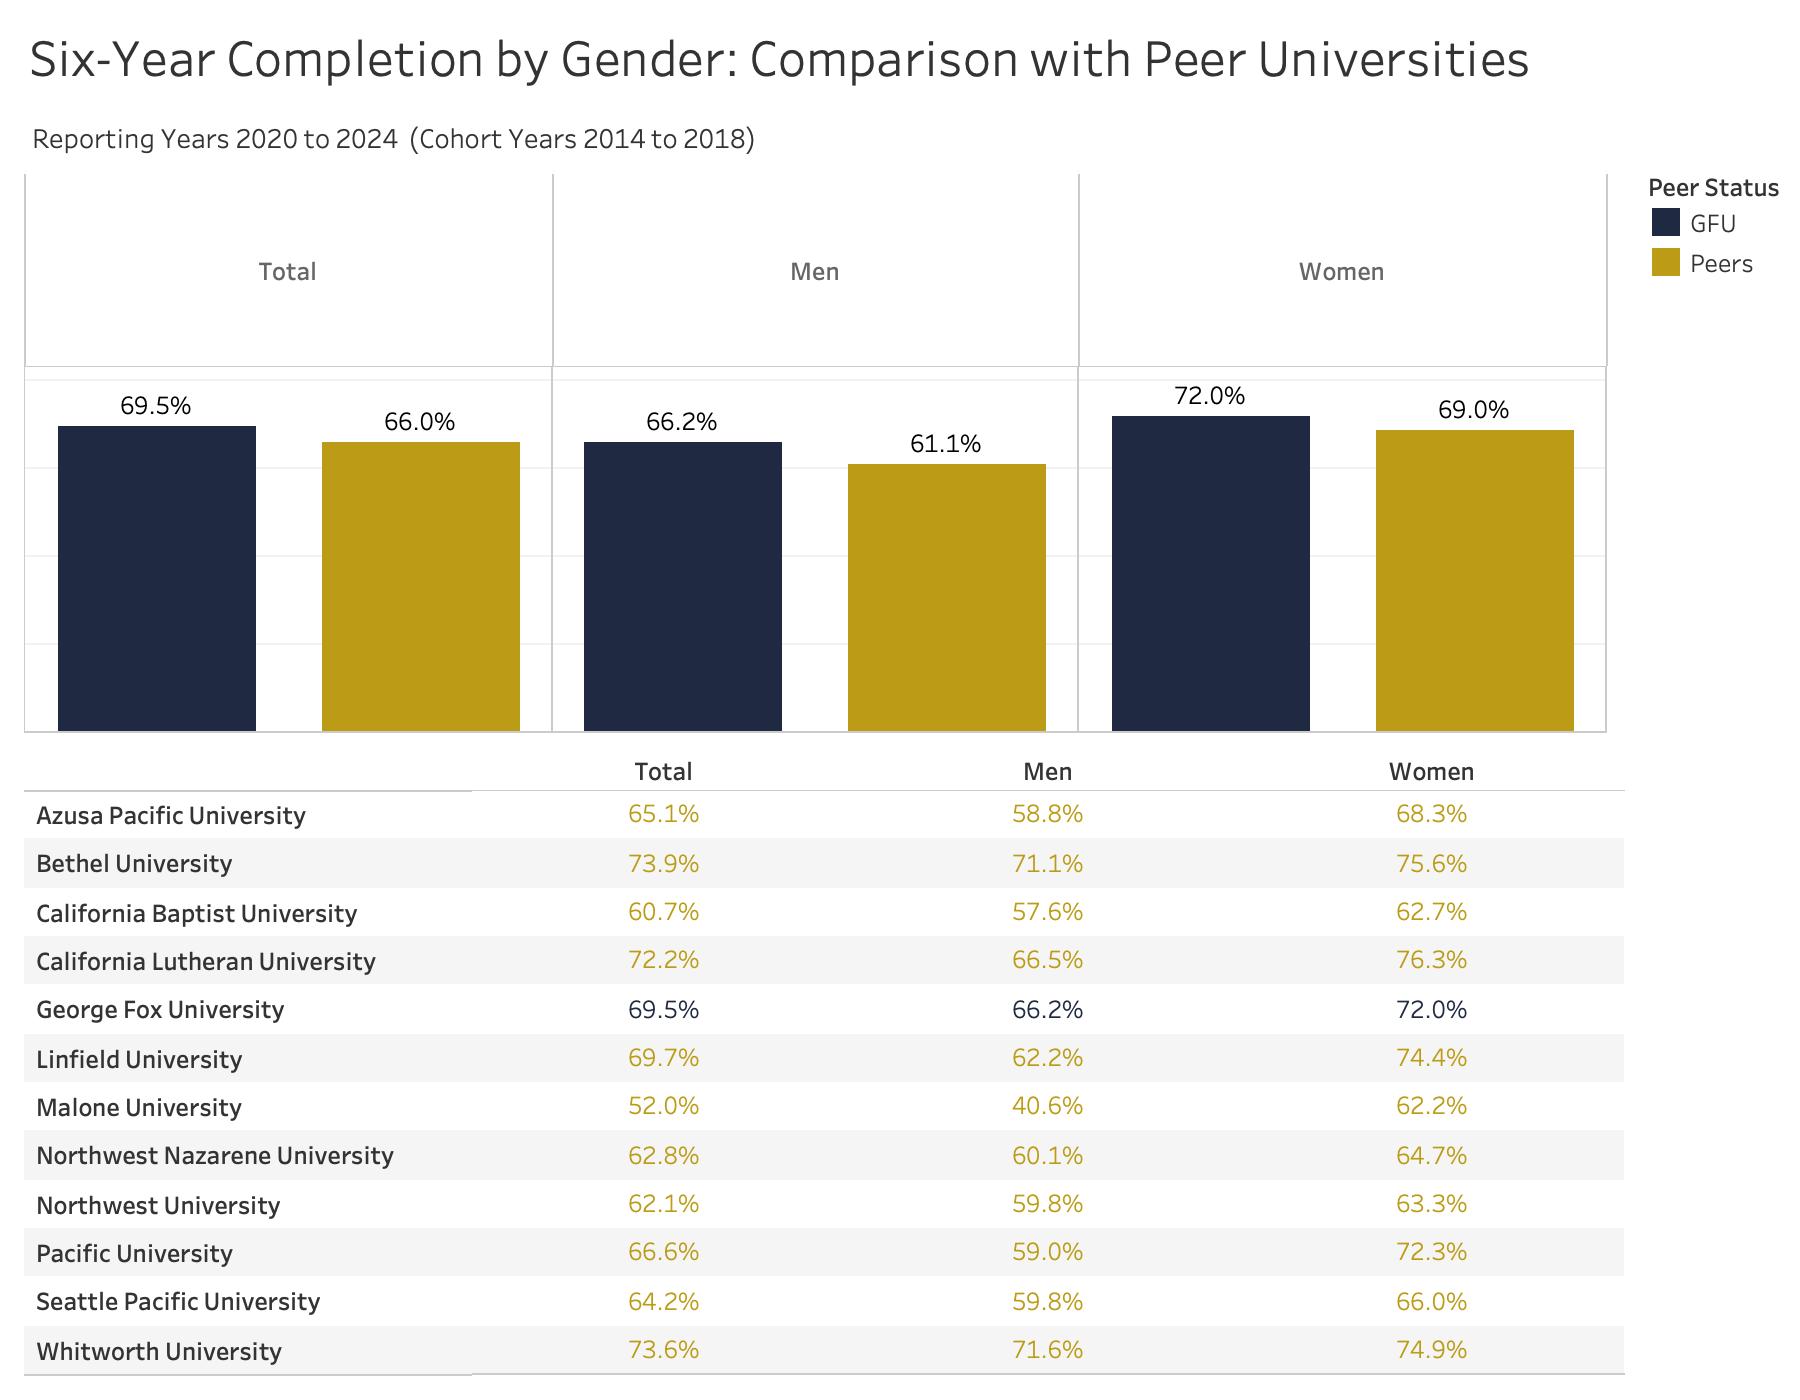
Source: IPEDS
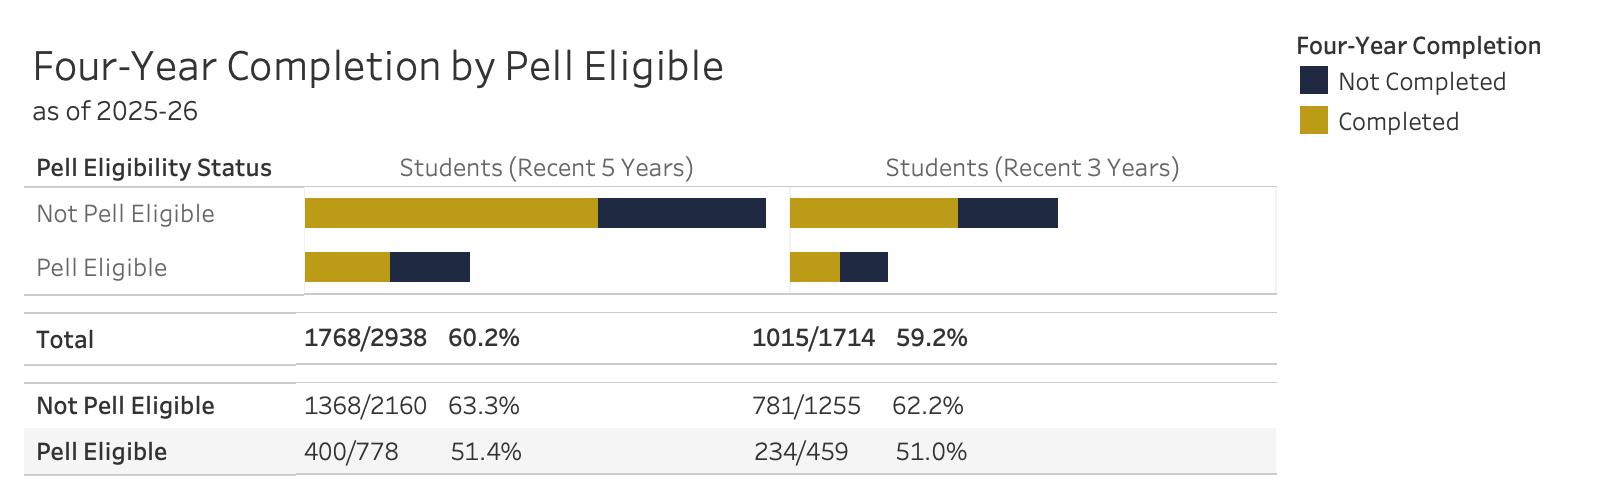
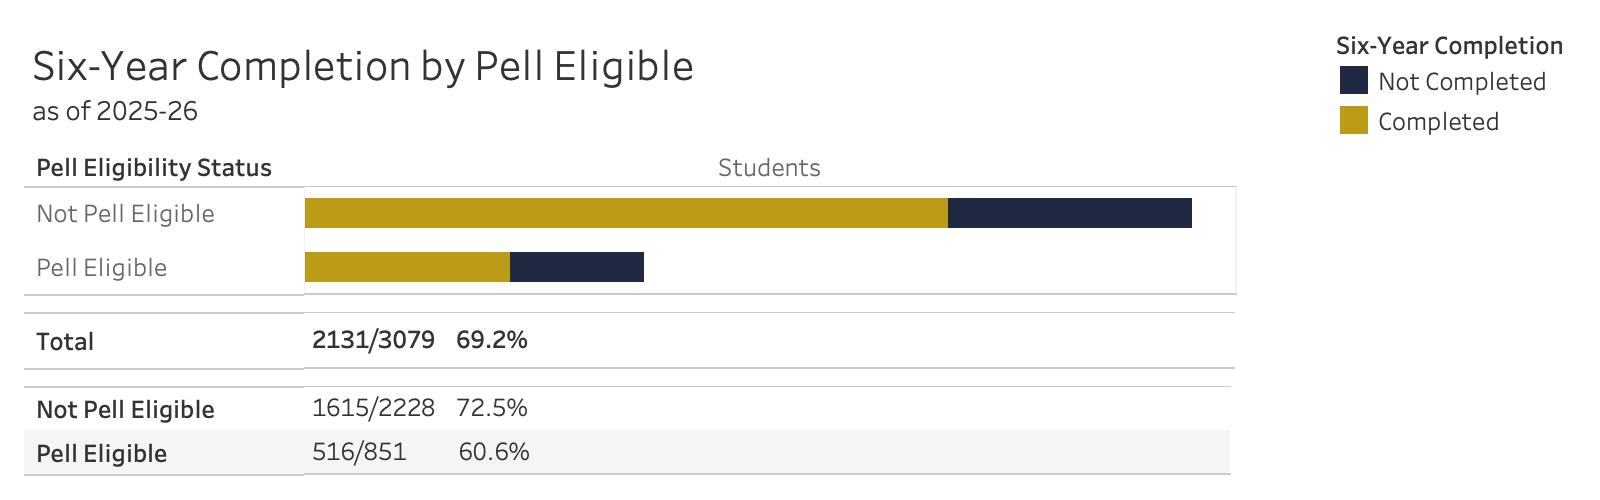
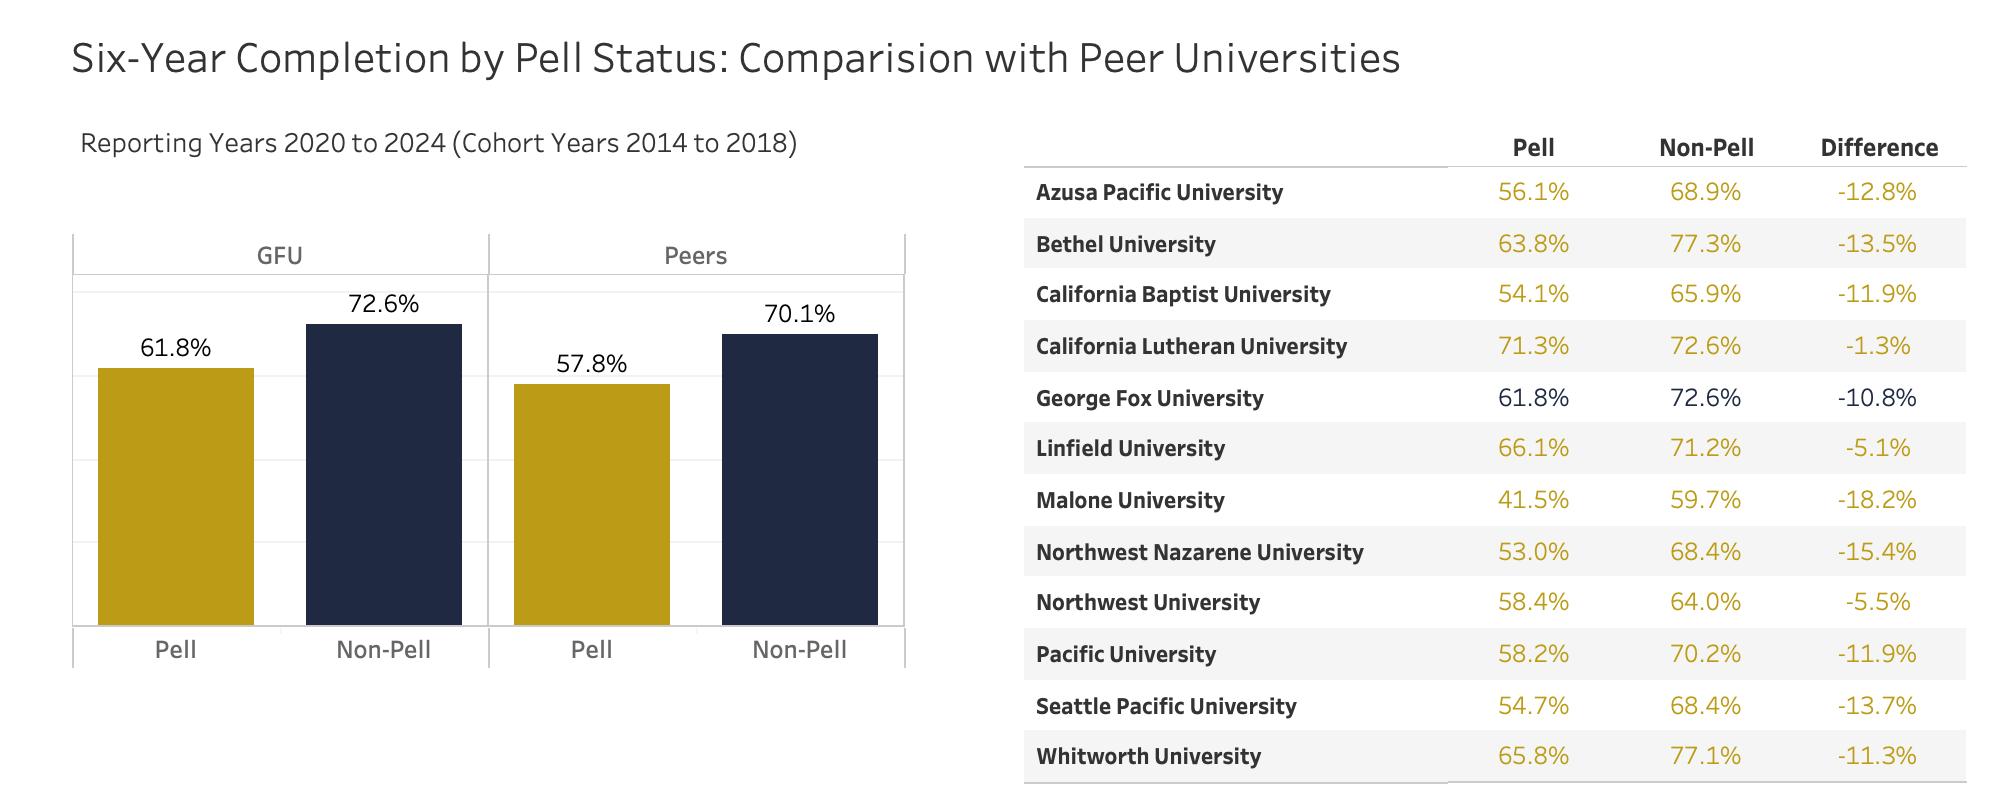
Pell Grant Eligibility
Federal Pell Grants usually are awarded only to undergraduate students who display exceptional financial need.
Source: IPEDS
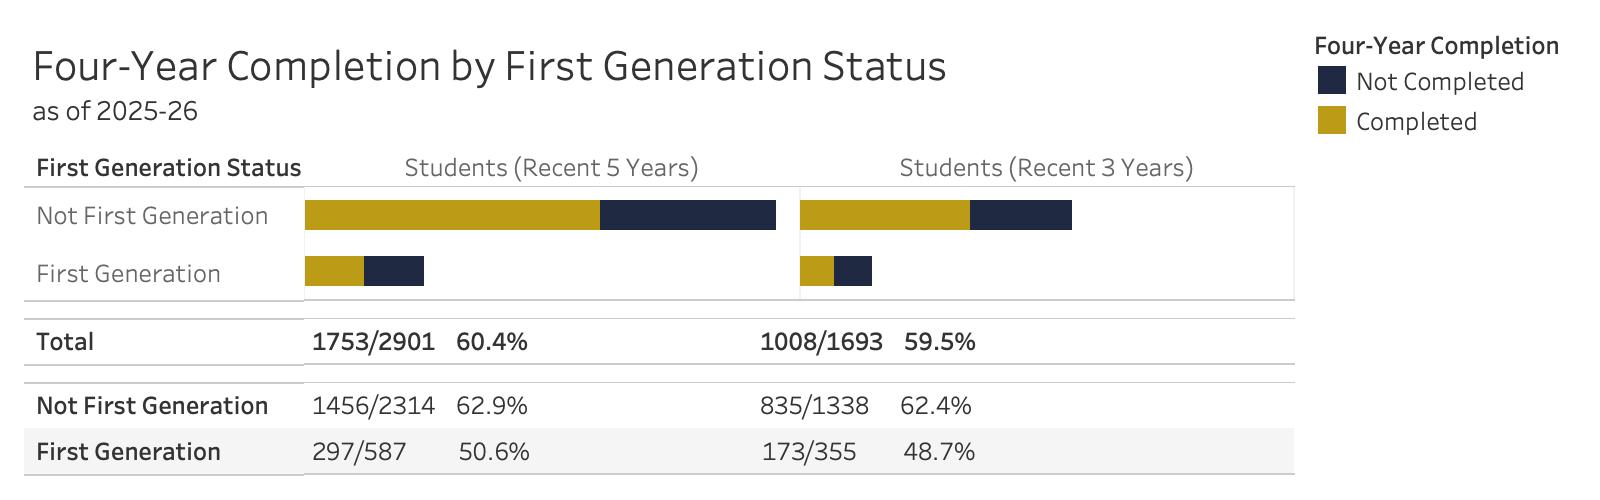
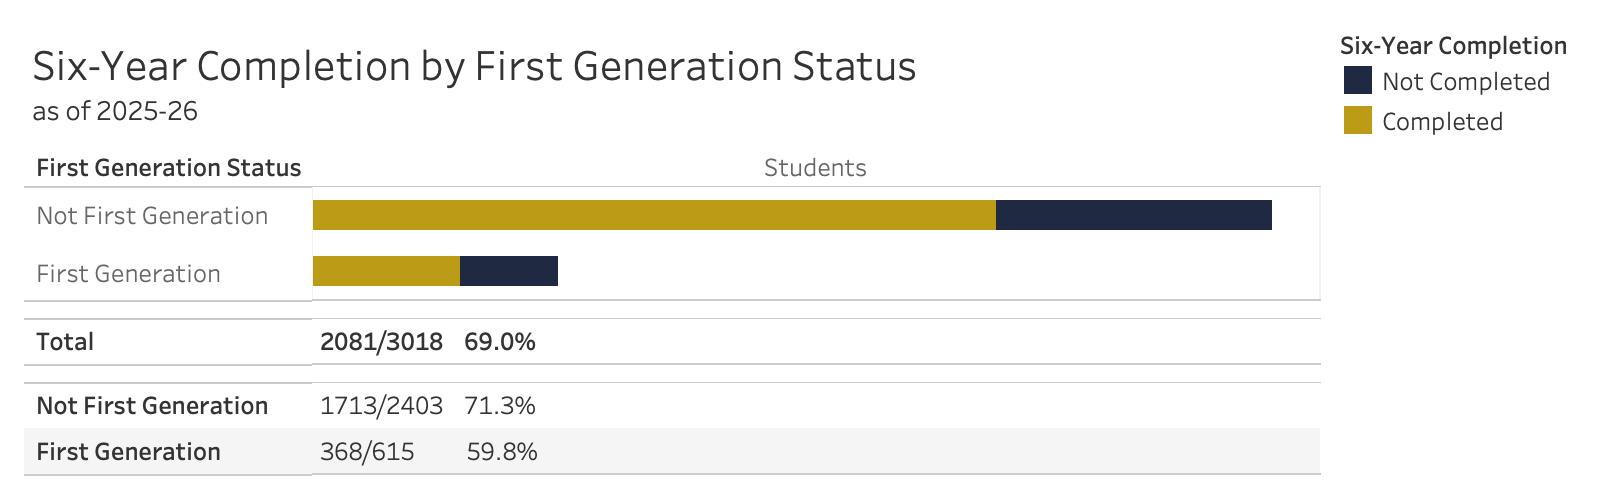
First Generation College Status
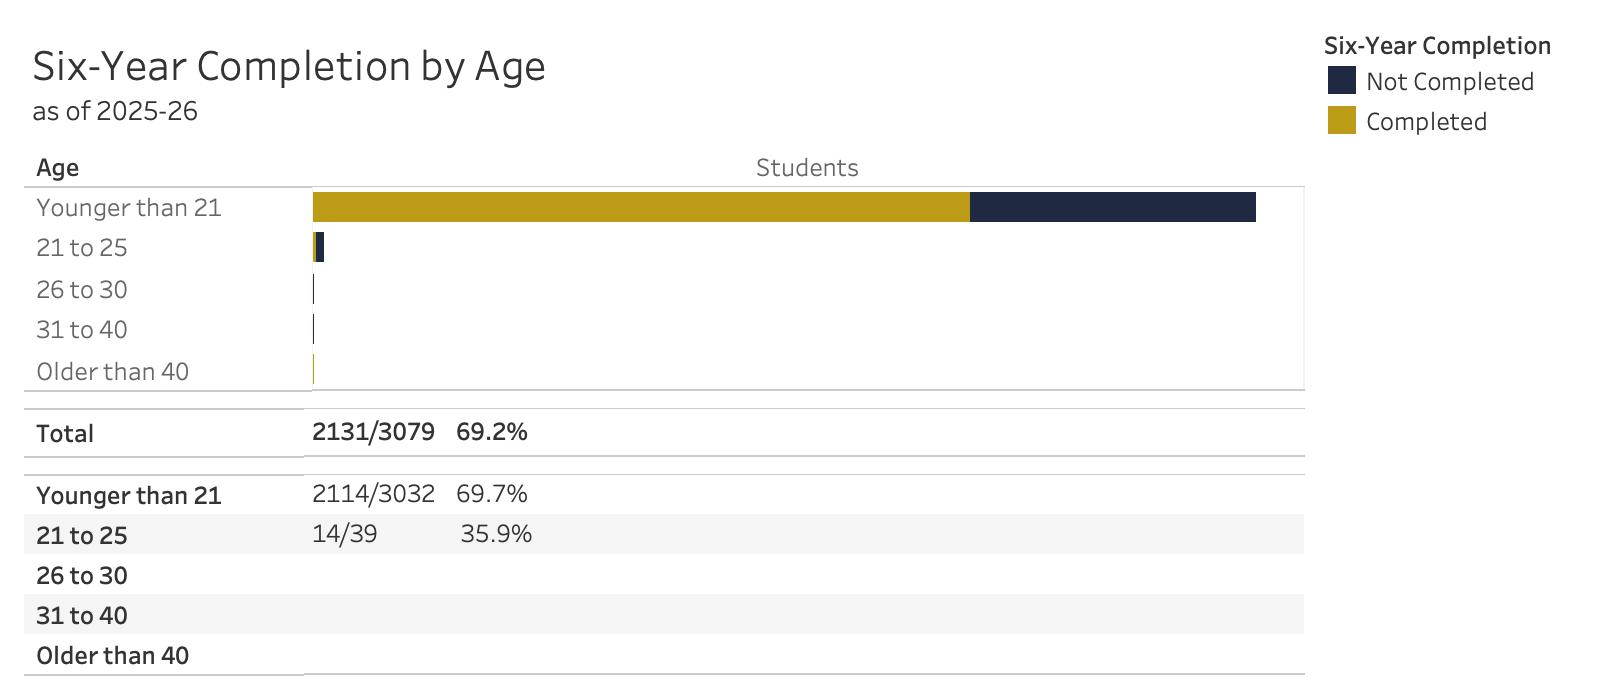
Age
Peer universities (selected based on faith-based / Christian, parental median income, size, mix of both graduate and undergraduate programs, regional and national institutions):
- Azusa Pacific University
- Bethel University
- California Baptist University
- California Lutheran University
- Linfield University-McMinville Campus
- Malone University
- Northwest Nazarene
- Northwest University
- Pacific University
- Seattle Pacific University
- Whitworth University
Source: IPEDS